
Introduction#
The last big project I worked on during my time at Yellowbrick was a brand new observability stack for the core product, an OLAP data warehouse. The company had finished a big push to create a cloud version of the product (which up to that point ran on a custom appliance) and we were finding that our mostly log-driven approach to observability was falling short. Diagnosing performance issues or failures took too much time and effort, and cloud customers had much different expectations on how to observe the health of their systems than our appliance customers.
The solution, at a high level, was straightforward: instrument the product to expose Prometheus metrics, and use Grafana to visualize them. Prometheus and Grafana are ubiquitous observability tools and would allow both developers and customers to get quick and meaningful insight into a running system. Reality was more complicated. In broad strokes, the data warehouse consists of three main components: the query planner, the compiler and resource manager, and the execution engine. These components were developed in three different languages, at different times, and by different people. The specifics of how we instrumented them are out of scope for what I want to talk about here, but it took several very talented engineers considerable time and effort to do.
One of the core expectations of this project was that we could see all metrics collected on all Yellowbrick systems, customer and internal, in real time. Several posts could be written about how this project as a whole was designed and implemented, but here I want to focus on the metrics transport - that is, how we reliably got metrics from all running Yellowbrick systems into a centralized Thanos deployment, and how we visualized them.
Requirements#
From here, we assume that the product is fully instrumented and exposes useful metrics via a collection of Prometheus-scrapable HTTP endpoints. The requirements for the metrics transport were:
- The metrics must be available in real time, or close to it.
- We could not lose data - if our infrastructure was unavailable, metrics needed to queue until transport resumed.
- We had to be able to remotely configure what metrics are sent to Thanos.
- Only data from systems with a valid license should be ingested.
- Support thousands of systems reporting metrics in parallel.
- Use the same dashboards we shipped to customers; dogfooding ensures they remain useful and polished.
Given these requirements, the naive approach of having Prometheus write directly to Thanos breaks down. Prometheus can be configured to write directly to Thanos using RWP (Remote Write Protocol), but using Prometheus’ RWP functionality alone can’t satisfy requirements 2 and 3, and while satisfying requirement 4 is technically possible, doing so is fragile in practice.
When Prometheus writes to a remote endpoint using RWP, it maintains in-memory queues to hold the samples. If the remote endpoint is unavailable for too long, Prometheus eventually starts discarding the oldest samples in the queues. How long “too long” is will depend on things like how many samples Prometheus is attempting to send and how much memory is available to Prometheus. In practice, this is on the order of minutes or hours, not days, and so satisfying requirement 2 isn’t feasible.
The fact that Prometheus’ configuration is static (it’s a file on disk) also presents issues. We felt that any approach that required rewriting Prometheus’ configuration file, be it in response to license changes or changes to what metrics we want to collect, opened us up to too much operational risk. If there was any problem in the configuration, we could not only interrupt the flow of metrics to Thanos, but also prevent Prometheus from coming online at all. For this reason, we could not satisfy requirements 3 and 4 with the naive approach.
Heimdall#
To satisfy all the requirements in an operationally stable way, we developed Heimdall. It comprises two binaries, Heimdall Egress and Heimdall Ingress. I built Heimdall in Golang because I’ve found it to be a wonderful programming language for tasks involving concurrency and parallelism (and I just genuinely enjoy working in it). The egress binary runs alongside Prometheus in the customer’s Kubernetes cluster and the ingress binary on “the mothership”. The mothership is a large virtual machine that runs Thanos, Heimdall Ingress, Grafana, and a few other supporting services.
Overview#
The two binaries work together to relay metrics from the customer’s Prometheus into Thanos. From the perspective of Prometheus and Thanos the ingress and egress binaries are just services that speak RWP, but to satisfy all our requirements they needed to do a bit more.
The egress binary is responsible for:
- Relaying metrics it receives from Prometheus to the ingress binary.
- Persisting metrics to a disk-based FIFO queue until the ingress binary confirms Thanos has accepted them.
- Filtering metrics with a whitelist and blacklist regex.
- Finding and attaching the customer license to each payload sent to the ingress binary.
The ingress binary is responsible for:
- Relaying metrics it receives from the egress binary to Thanos.
- Checking that payloads have a valid license attached.
- Maintaining a whitelist and blacklist regex per tenant (i.e., customer) that the egress binary can query for.
Before we go any further, let’s see how data flows through this system. It’ll do wonders to keep us on the same page as we dive into the details. The arrows reflect the flow of data.
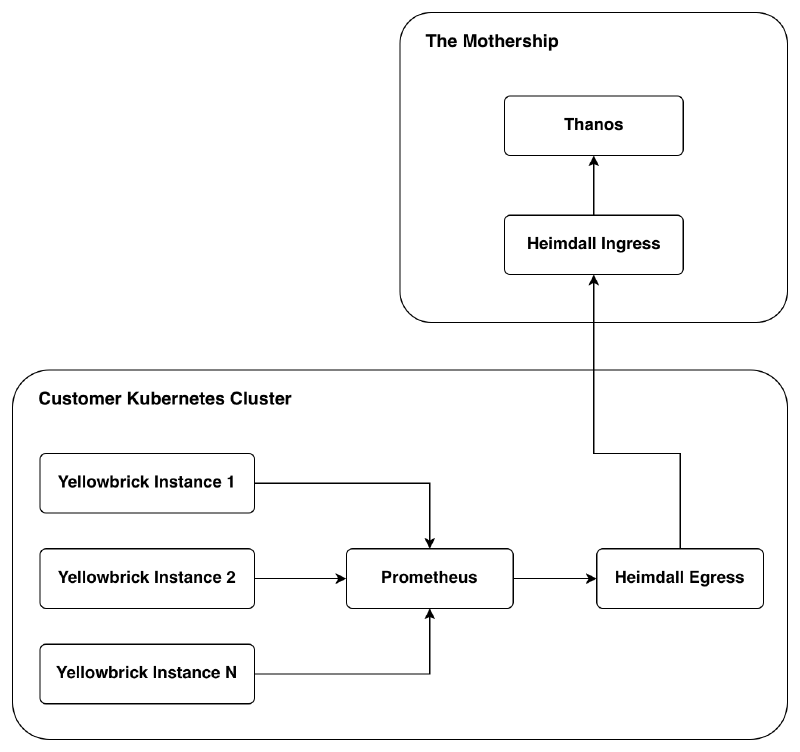
Prometheus scrapes the various endpoints exposed by each instance of the instrumented data warehouse and relays them to the egress binary via RWP. The egress binary sends the RWP payload (after filtering it through the whitelist/blacklist) onto the ingress binary, attaching the license (JWT) as an HTTP header. Finally, the ingress binary sends the RWP payload to Thanos if the license is valid, and returns an HTTP 200 to the egress binary to let it know the payload has been received and can be dropped.
Egress#
There are two important flows worth covering in the egress binary: forwarding data from Prometheus to Thanos, and fetching the whitelist and blacklist.
The high-level process for receiving and sending RWP payloads looks like this. I omit the details on retrieving a license because it’s not very interesting - I just use the Kubernetes API to query for a configmap with a known name (and cache the result to avoid future lookup times).
When metrics come in from Prometheus, they are first fed through a whitelist and blacklist. There are two key reasons we can’t simply ship all metrics Prometheus collects to the ingress binary:
- We can’t know the volume of data a customer’s Prometheus installation will produce, and there is no good reason to store metrics we are not interested in.
- Customers might produce metrics with data they wish to keep private.
The reason we have both a whitelist and a blacklist (which are regular expressions) is really to accommodate cases where we want all metrics of the form yb_.*, but don’t want yb_bad_metric. Without the blacklist we would need to turn that whitelist expression into an explicit list of every metric of that form except yb_bad_metric - this would quickly become a headache.
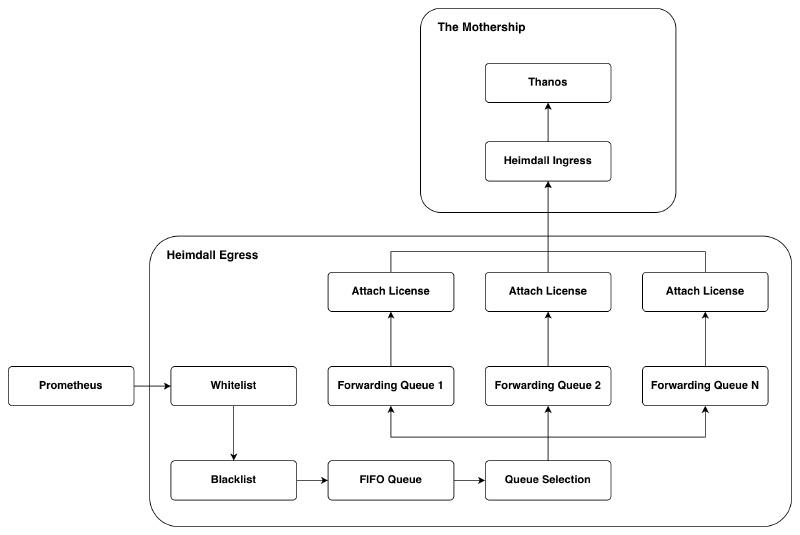
To begin whitelist and blacklist filtering, the egress binary needs to unpack the RWP payload to know the metric names. Any metrics that make it through this filtering are then re-packaged and committed to the FIFO queue. In a separate thread the RWP payloads in the FIFO queue are read and unpacked again. The metric names are then hashed so we can place the data in one of N forwarding queues (which all execute concurrently). Metric names must be deterministically assigned to the same queue because RWP specifies (and Thanos enforces) that data sent for a metric must not have a timestamp older than data already received for that metric. If two samples with the same metric name landed in two different queues, then data could arrive at the ingress binary in the wrong chronological order. When a forwarding queue fills up (or a repeating timeout is hit), the contents of a queue are packaged as an RWP payload and sent to the ingress binary with the customer’s license. One might say that we are doing too much work by unpacking the payload twice, but consider:
- To keep as much disk space available as possible for the metrics we want, it makes sense to filter before putting payloads into the FIFO queue.
- Queue selection could be done here, but then the number of forwarding queues could not be changed without the risk of sending data in the wrong order.
For these reasons, we pay the price of unpacking twice. I had the same concern, but after some testing I found it did not matter at all. The egress binary is mostly network-bound - the only time it used a meaningful amount of CPU was on our internal Kubernetes cluster that had hundreds of data warehouse instances running at any given time.
The reason we have more than one forwarding queue is to accommodate bigger deployments. On a typical deployment one forwarding queue is sufficient, but on large deployments or deployments where latency to the mothership was high, we found that the egress binary would struggle to keep up. In some of the worst cases we found the egress binary would fall further and further behind, but these problems disappeared with the parallelism introduced by several forwarding queues.
Moving on, the ingress binary will send back an acknowledgement or failure. There are three broad cases the egress binary has to deal with:
- Payload accepted: Drop the payload from the FIFO queue.
- Failure but try again: Wait some time and try again, but don’t discard from the FIFO queue. This could occur if the mothership is offline or partially degraded, for example.
- Failure but don’t try again: Drop the payload from the FIFO queue. This could occur if Thanos says the payload is malformed, in which case trying again would not help.
The last thing I want to go over on the egress binary is the whitelist and blacklist. The egress binary fetches the whitelist and blacklist from the ingress binary. The egress binary includes the customer license in this request as well so the ingress binary knows which whitelist and blacklist pair to send back, as each tenant can have their own. From the perspective of Heimdall, a tenant is a Kubernetes cluster. The license sent to the ingress binary contains information like customer name, cloud provider, region, and Kubernetes cluster name. Using this information we can derive a unique tenant ID. If the egress binary is unable to get a whitelist and blacklist pair from the ingress binary, a broad default is used for each.
Ingress#
Of the two binaries, Heimdall Ingress is the simpler one. It just forwards data to Thanos if the attached license is valid, and maintains a whitelist and blacklist pair for each tenant.
License validation is simple. The ingress binary has a store of public keys and checks to see if the JWT was signed by one of those keys. If the signature is good and the license is not past its expiration date, it’s considered valid. We cache successful validations to avoid paying the validation cost each time a payload is received. If an invalid license is detected, the egress binary is told to keep the payload and try again. This is to not lose metrics in cases like a license lapsing and then being renewed the next day. Requests with valid licenses will have their payloads forwarded to Thanos and the reply will be sent back to the egress binary so it can decide what to do with the payload.
The thanos-tenant HTTP header in the request to Thanos is set to the tenant ID derived from the customer license. Under the hood, Thanos stores each tenant’s data in a separate TSDB (time series database). This is great for addressing any concerns with mixing customer data, and it also means queries for a given tenant only need to search through the data for that tenant.
When the egress binary requests a whitelist and blacklist pair, it also includes a copy of the customer’s license. The ingress binary will check to see if a pair exists for the tenant and return it if so. If we haven’t set up a specific pair for a tenant, then a default is returned. The whitelist and blacklist pairs are just files on disk with deterministic names. Like many other places in this system, a cache here is used to avoid the cost of repeated lookups.
Thanos#
We’ve now seen how data arrives at Thanos, but so far I’ve abstracted Thanos away as a single entity. In reality, Thanos is a collection of processes that work together. Let’s zoom in on the Thanos box we’ve seen in the diagrams so far and look at what I actually set up.
Plumbing#
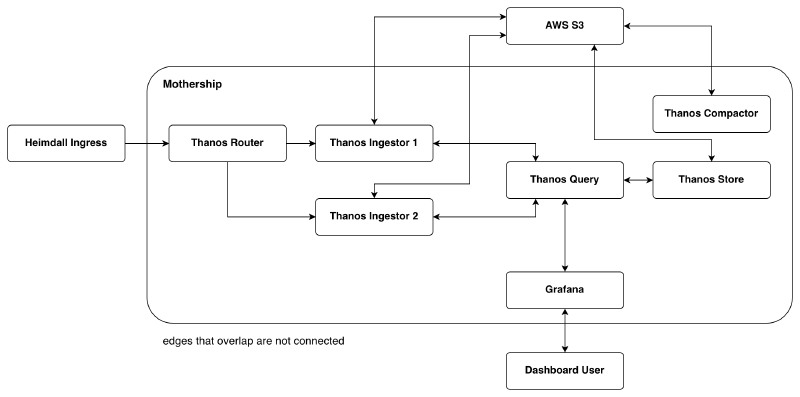
Heimdall Ingress sends RWP payloads to the Thanos Router. The router is a lightweight and stateless process that distributes metrics to the Thanos Ingestors. It’s aware of the ingestors via its configuration file and uses a hashing algorithm to determine which ingestor to send any given metric to. As a side note, one should opt for the ketama hashing algorithm as it’s a stable hashing algorithm and allows for simple horizontal scaling of Thanos Receivers.
The Thanos Ingestors are, in effect, small Prometheus servers. They each maintain a local TSDB and store metrics they receive from the Thanos Router. Every two hours each ingestor uploads a block of data for the last two hours into object storage (AWS S3 in our case). The routers and ingestors are actually the same Thanos process (thanos receive), but take on different responsibilities based on their configuration. It is possible to have one process be both a router and an ingestor, but I chose to break things out into separate processes because the ingestors do significantly more work than the router and that’s where I will want to scale. Annoyingly, the documentation for thanos receive does not make it clear at all (at least at the time of writing this) that one could make the process behave as an ingestor only, but I found a blog post on the Thanos website that outlined how to do it.
The Thanos Compactor has two responsibilities: to compact blocks uploaded to object storage and to downsample data. How Prometheus blocks work is out of scope for what I want to discuss here, but in general you can assume fewer blocks means less storage used, quicker lookups, and better indices. Downsampling also plays an important role in performance. For example, if one is visualizing a metric over a whole month, it is very unlikely full resolution for that metric is needed - samples with one hour resolution usually do just as well as samples with one minute resolution.
Retrieving data from the object store is handled by the Thanos Store component. It pulls down the appropriate blocks from object storage to its local disk and executes the query against that data.
Queries for metrics first land at the Thanos Query component. The result set that Thanos Query sends back for a given query is the union of the result sets from applying that query to the data in each ingestor’s local TSDB, and the data in object storage (via Thanos Store). Remember that metrics are sent to different ingestors based on their hash value, so the data on all ingestors must be scanned to produce the correct result set.
Scalability and Performance#
The mothership is where all scalability concerns are. The customer-side components (Prometheus and Heimdall Egress) were able to handle the load of our internal Kubernetes cluster that has hundreds of instances running; a typical Yellowbrick deployment will have fewer than ten instances running.
To scale the write side of this system, we need to target the router and the ingestors. The ingestors would be the first that need to scale as they do significantly more work than the router. Thankfully, they can scale horizontally and even run on other virtual machines. The router would eventually need to scale horizontally too, but at a much slower pace than the ingestors since the router does so little work (relatively speaking). All of the back pressure in the system is here as well. Each Heimdall Egress binary out in the wild will only have a handful of parallel connections open to the mothership, and they will only send more data as they get back confirmations from Thanos (via Heimdall Ingress). This means the rate at which this system can ingest data will be limited by how well we scale the routers and ingestors, and how fast the ingestors’ disks are.
Scaling on the read side is affected by how well the Thanos Store component scales, but also how the ingestors scale. Recall that the data we get back for a query comes from both the store component and the ingestors. The store component scales horizontally and can run on different virtual machines. There are a couple of broad ways to scale the store component (hashed vs replica), but we hadn’t hit the need for it, so I could only speculate on what would be most appropriate for this system. The read rate is then limited by:
- The compute power of the ingestor and store components.
- The disk speed of the ingestor and store components.
- The bandwidth between the store components and the object storage.
We had no real concerns about the bandwidth between Thanos Store and object storage - the mothership is a virtual machine in AWS and we use their S3 service. The compute power and disk speed for the ingestor and store components can be practically scaled out by converting the mothership to be a collection of virtual machines, which presents no real technical challenges, we just haven’t needed to go that far yet.
The Thanos topology I presented above has so far worked very well for Yellowbrick. Data for thousands of instances is flowing in and engineers are able to observe all corresponding systems in real time. Neither CPU, memory, nor disk are overly taxed on the mothership, which is running on a mid-size virtual machine. This design should scale to meet the organization’s needs for years to come. If we were to scale to millions of tenants the system design would need to be reconsidered, but that’s a welcome problem of success. Our resources weren’t infinite, so we focused on something practical we could get going sooner rather than later, while still reasonably accommodating future growth.
Grafana#
The primary way we expected customers and engineers to interact with the system was via Grafana. The main point of this post is about the metrics pipeline itself, but I did want to touch on Grafana a bit as the dashboards are the most tangible result others would see of our work.
From the very start, we committed to having the dashboards our customers saw be first-class citizens - they needed to be useful and polished. We felt the best way to ensure this was to dogfood them. The dashboards we used internally for engineers, support staff, etc., were the same dashboards we shipped to our customers. To make the dashboards useful when querying across all of our tenants, I created a script that would modify each dashboard to have an extra Grafana variable (i.e., a dropdown at the top of the dashboard) to select the tenant we were interested in. I used a Golang library to parse the PromQL queries for each of the visualizations and add tenant_id="TENANT_OF_INTEREST" to each query - when this label is set Thanos will only scan the matching TSDB. Other than that, the internal and customer dashboards were functionally and visually equivalent.
Releasing the dashboards internally was a very rewarding experience. Very quickly I started to get bug reports, requests for new visualizations, and questions about how to add new metrics to the product. This told me others were getting value out of it right away - the best tools are the tools that actually get used.
Conclusion#
We set out to solve two broad problems:
- Provide customers with measurable insight and observability into the product.
- Capture health and diagnostic data for all Yellowbrick systems in near real-time.
To do that, we built an observability stack using Prometheus, Thanos, Grafana, and a pair of home-grown binaries called Heimdall. We kept resource overhead at customer sites low, and used battle-tested off-the-shelf software to get the project off the ground as quickly as possible. As a quick summary, the system we created:
- Enforces licensing.
- Allows us to dynamically select what metrics to collect per tenant.
- Scales in a predictable way as load increases.
- Keeps metrics data safe in failure conditions.
- Provides both customers and engineers with a well-known interface for turning raw metrics into actionable insight.
We designed and built this system to scale with the company’s needs as we understood them at the time, and it has proven capable of doing so. Startups (and most companies) don’t have the luxury of building for every hypothetical future, so we focused on what we actually knew, and built something quickly (but without sacrificing quality).
It was a real pleasure to work on this project. I got to touch essentially every part of the core stack, interact with engineers and stakeholders across the whole company, and do some exciting greenfield work. In my opinion, it was one of the most interesting engineering projects happening in the company, and I’m thankful I got to be one of the driving forces moving it forward. For those of you that made it this far, thanks for reading!